Graph Problems - Part I
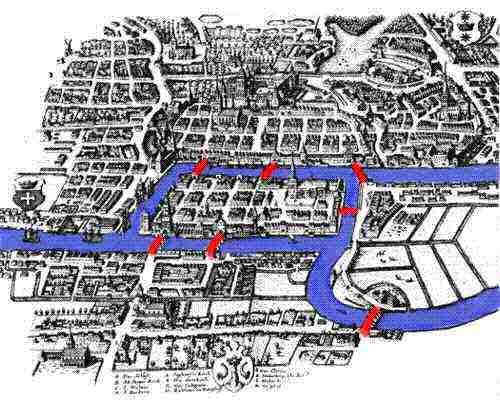
Graph theory as we know it today began with the Königsberg Bridge Problem and its solution by Leonhard Euler. The problem was whether it was possible to walk a path through the city, crossing each of the seven bridges (Figure 1) exactly once and returning to the starting point. Apparently, this was a traditional challenge among the residents, and while no one had ever found a way to do it, neither was anyone able to say with certainty that it could not be done.

In order to describe the problem precisely and reason rigorously to reach a solution (showing that the desired path does not exist), Euler developed a notational system and the basic axioms that are the foundation of graph theory. Today, the methods of graph theory are used to solve practical problems in areas as diverse as fleet management, network design, disease transmission, and circuit board layout.
In most Olympiad challenge sets, there is at least one problem that can be modeled with tools from graph theory. For that reason, it is important that you practise how to create and analyse representations of graphs. In this challenge, you will learn a common way that the examiners use to describe a graph, and you will learn one of the ways that you can store the graph so that you can analyse it easily.
Essential Vocabulary
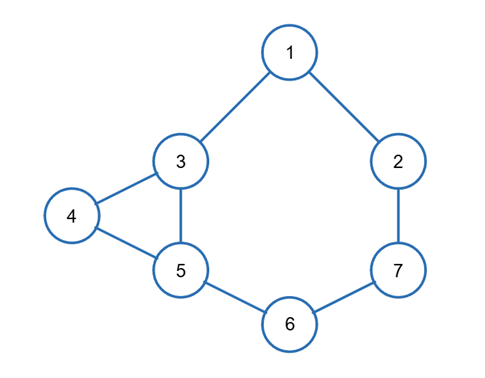
A graph consists of points called vertices and connections between them called edges. In a maths class, graphs are drawn as in Figure 2 below. As you can see, vertices are drawn as numbered circles and edges are drawn as lines that connect them together.

When you model a real-world problem a vertex will represent something specific like a city, and an edge will represent something like a rail line that runs between cities. Unfortunately, calling a vertex "Manchester Piccadilly Station" and an edge "The Mid-Chesire Line" would be inconvenient and limiting. Both in maths class and programmatically, the usual way to identify a vertex is with a positive integer. If there are \(n\) vertices in a particular graph, they will be numbered \(1\) through \(n\) (consecutively, with no gaps) most of the time.
In our problems, an edge will usually connect two distinct vertices (in maths class, an edge can sometimes connect a vertex to itself, but you won't see that very often in programming contest problems), and most of the time there will be either zero or one edge (not multiple edges) between any two vertices. For that reason,we can conveniently name an edge using the numbers of the two vertices it connects. For example, an edge that runs from vertex \(3\) to vertex \(8\) is usually called \((3, 8)\) both in maths and in programming.
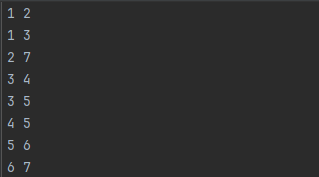
One way that the examiners use to describe a graph precisely is with an edge list. For example, they might ask you to read in a file that contains the following:

In this file, only the vertices appear, and the brackets and commas used in a maths class are omitted. Reading through line by line, we can see that there is an edge connecting vertex 1 to vertex 2, an edge connecting vertex 1 to vertex 3, an edge connecting vertex 2 to vertex 7, and so on. This edge list describes the graph we saw above in Figure 2.
Although there are various ways of representing a graph in your program, a particularly useful way is with an adjacency list. If two vertices are connected by an edge, they are said to be adjacent. An adjacency list is a data structure that has an entry for each vertex in the graph, and each entry is a list of all the vertices that are adjacent to the element's corresponding vertex. Figure 4 shows the adjacency list for the graph of Figure 2.

The adjacency list says that vertex 1 is adjacent to (that is, connected to) vertices 2 and 3. Vertex 2 is adjacent to vertices 1 and 7. And so on. This representation of the graph is convenient because you can use an indexed collection (such as an array in C, a list in Python, or a vector in C++) for the list. For example, if you use "adjacency_list" as the name of the list, then adjacency_list[5] gives you a list of all the vertices that are connected to vertex 5.
When you make the adjacency list, be aware that you are making a two-dimensional data structure. Each element is itself a collection of elements. For example, in Python you might want to make a list of lists:

Challenge
Write a program that will read an edge list from the file "input.txt" and store the graph as an adjacency list. Print the adjacency list.
I recommend that you make a class (assuming Python or C++) for working with graphs. Implement the following:
- An instance method to add a connection. This takes as arguments the two vertices that describe an edge and enters them into the adjacency list.
- A way to print out the adjacency list. In Python, override the __str__(self) function to make a string of the form shown in Figure 4. In C++, write a non-static (instance) method called to_str() that does this.
In the next challenge of this series, we will develop your class further and find the shortest path between two vertices.
Takeaways
This challenge requires you to build upon the fundamental collections for data in your language of choice to make complex data structures. It also introduces some of the terms associated with graph problems in maths and programming. This may also be the first time you have used classes, which are the preferred way to approach complex data types in C++ and Python.